Welcome
This website showcases my participation in the 30 Day Chart Challenge.
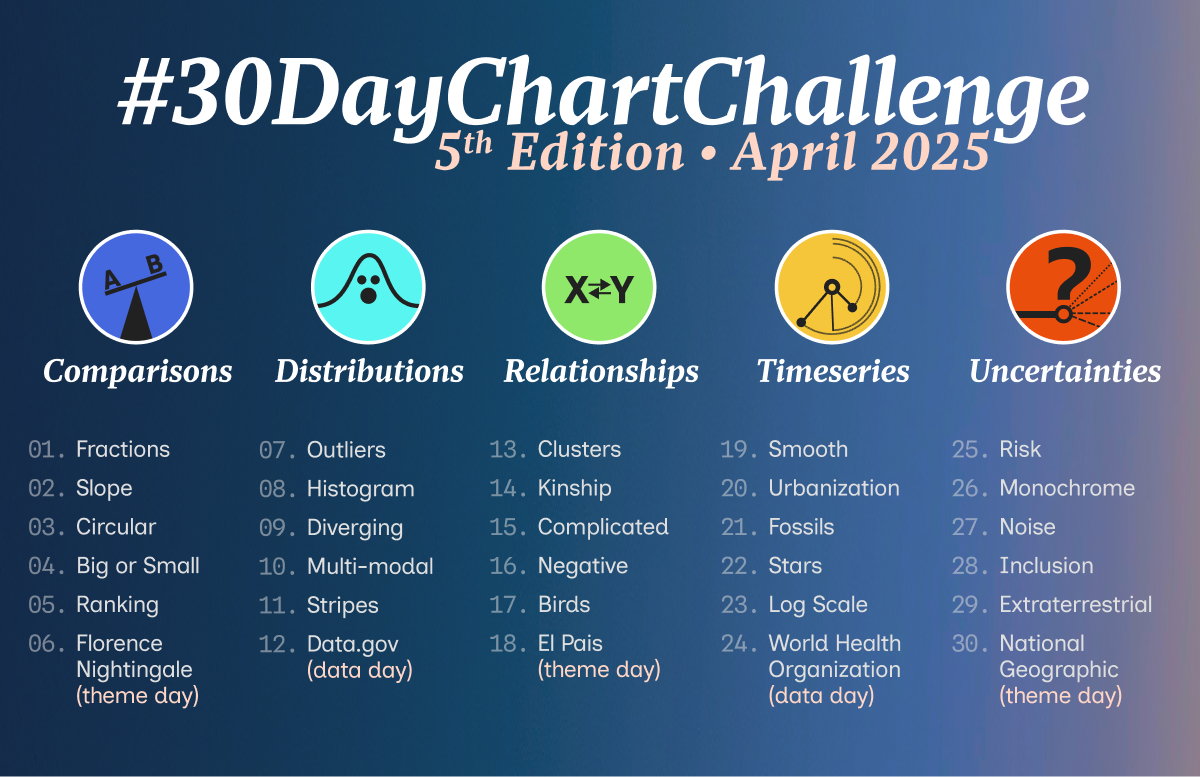
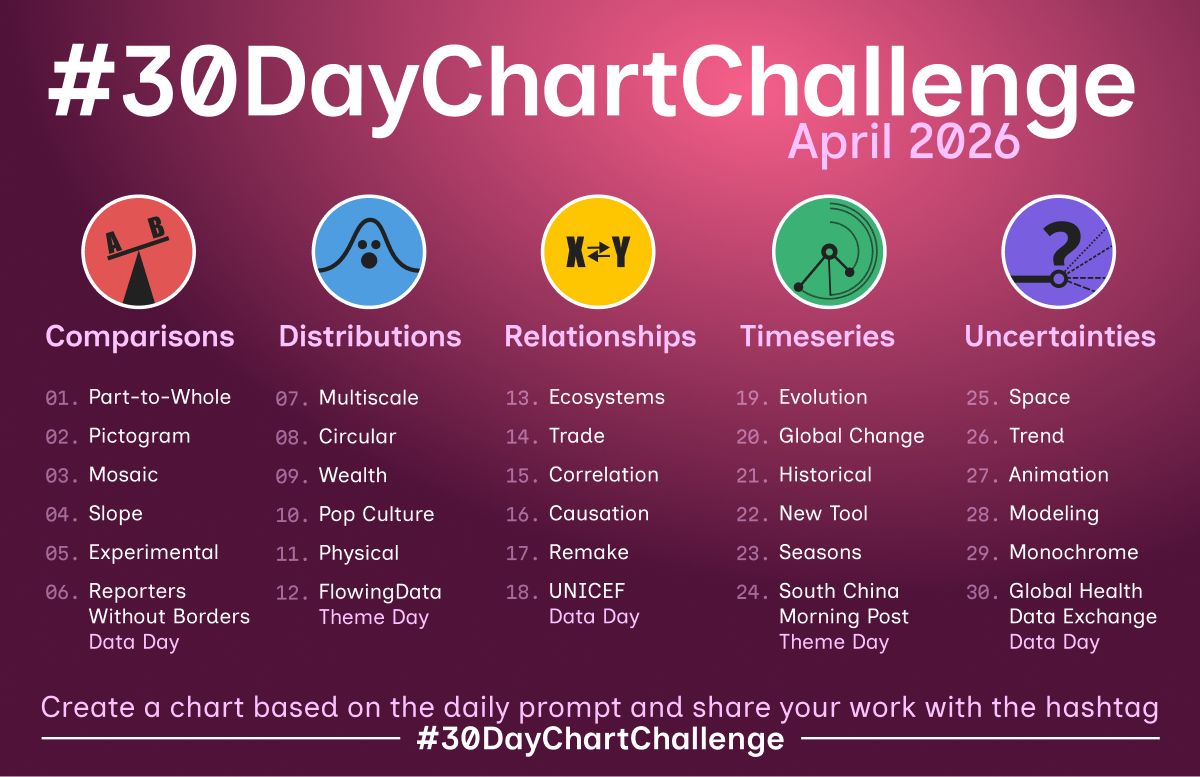
The #30DayChartChallenge is a data visualization event where participants create and share one chart per day throughout the month of April, each inspired by a specific daily theme and prompt. It’s a creative way to explore data, experiment with visual storytelling, and improve charting skills.
Check out the challenge details on the official GitHub page.
You can find all the code, data, and individual plots in my GitHub repository.
Feel free to explore the charts by week and day using the navigation menu above!