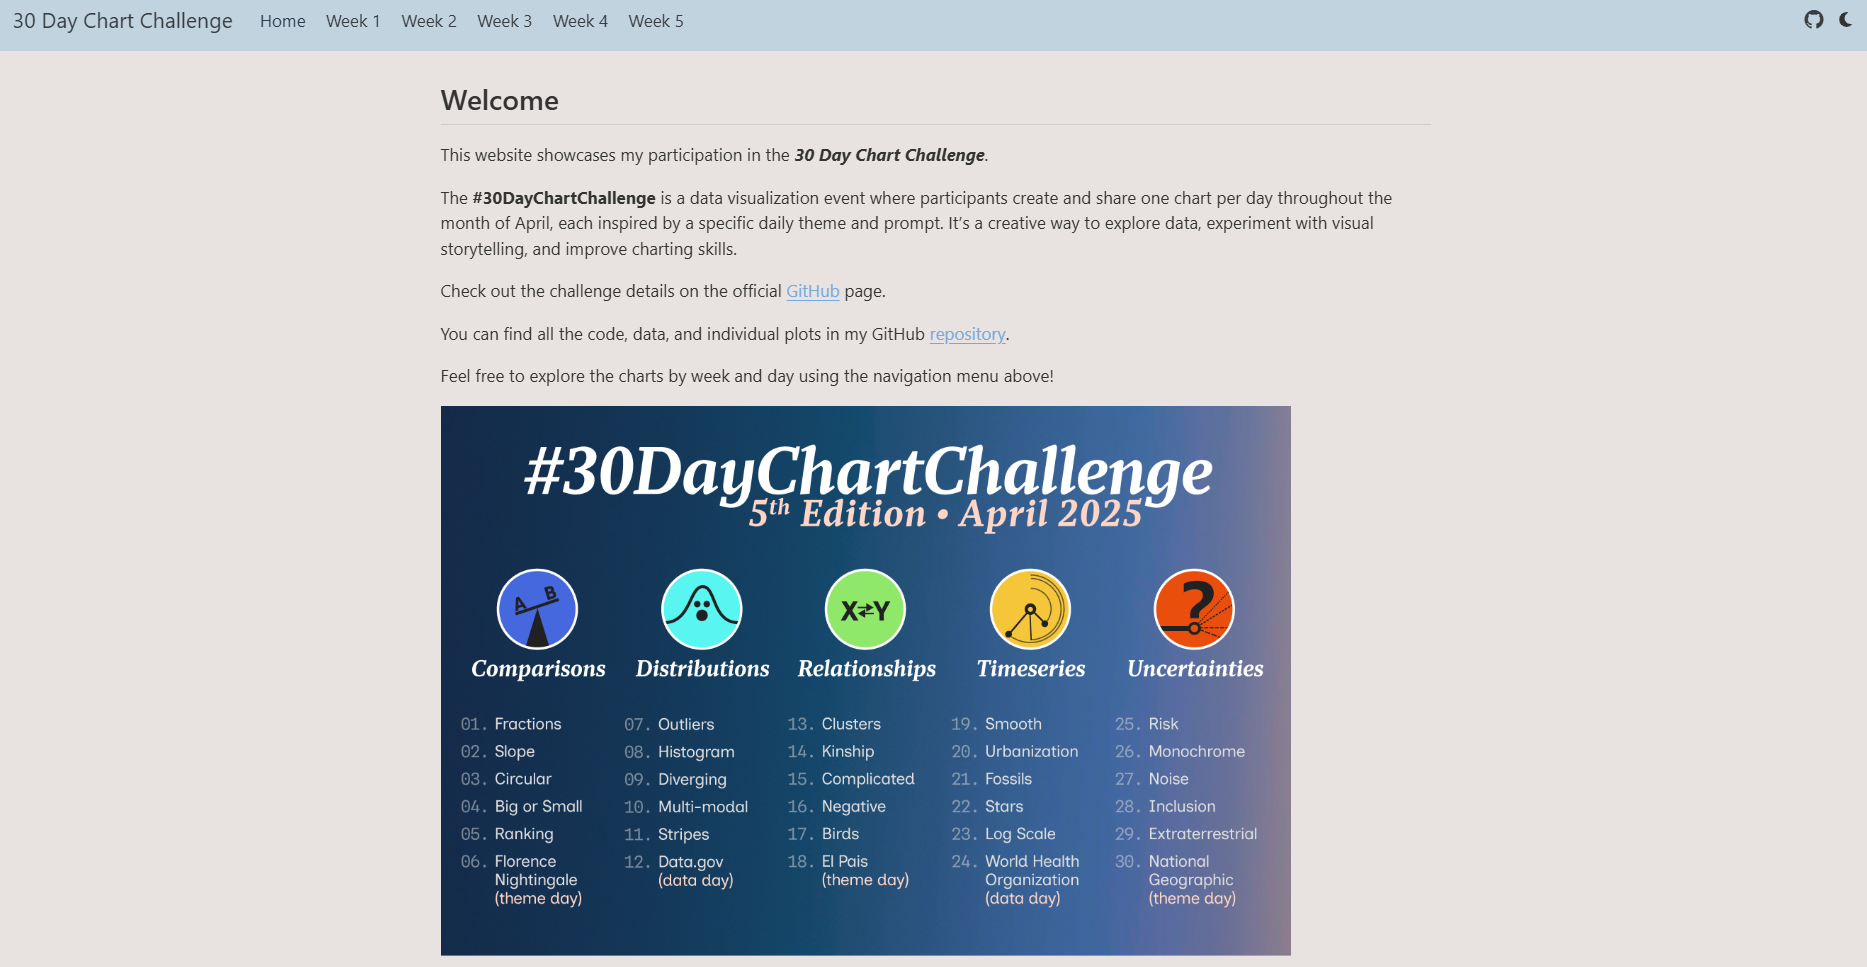
A collection of data visualizations created for the #30DayChartChallenge, exploring different chart types, styles, and storytelling techniques in R.
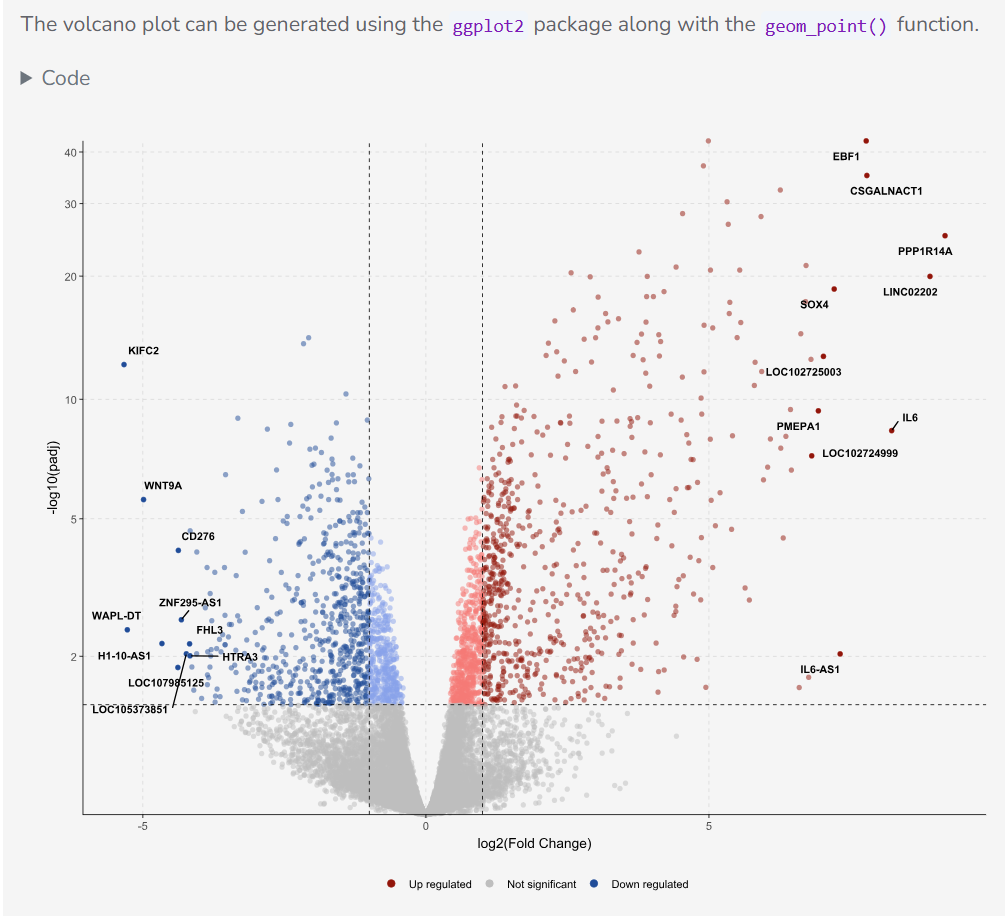
A collection of charts made with the R programming language, focusing on immunogenetics analyses.
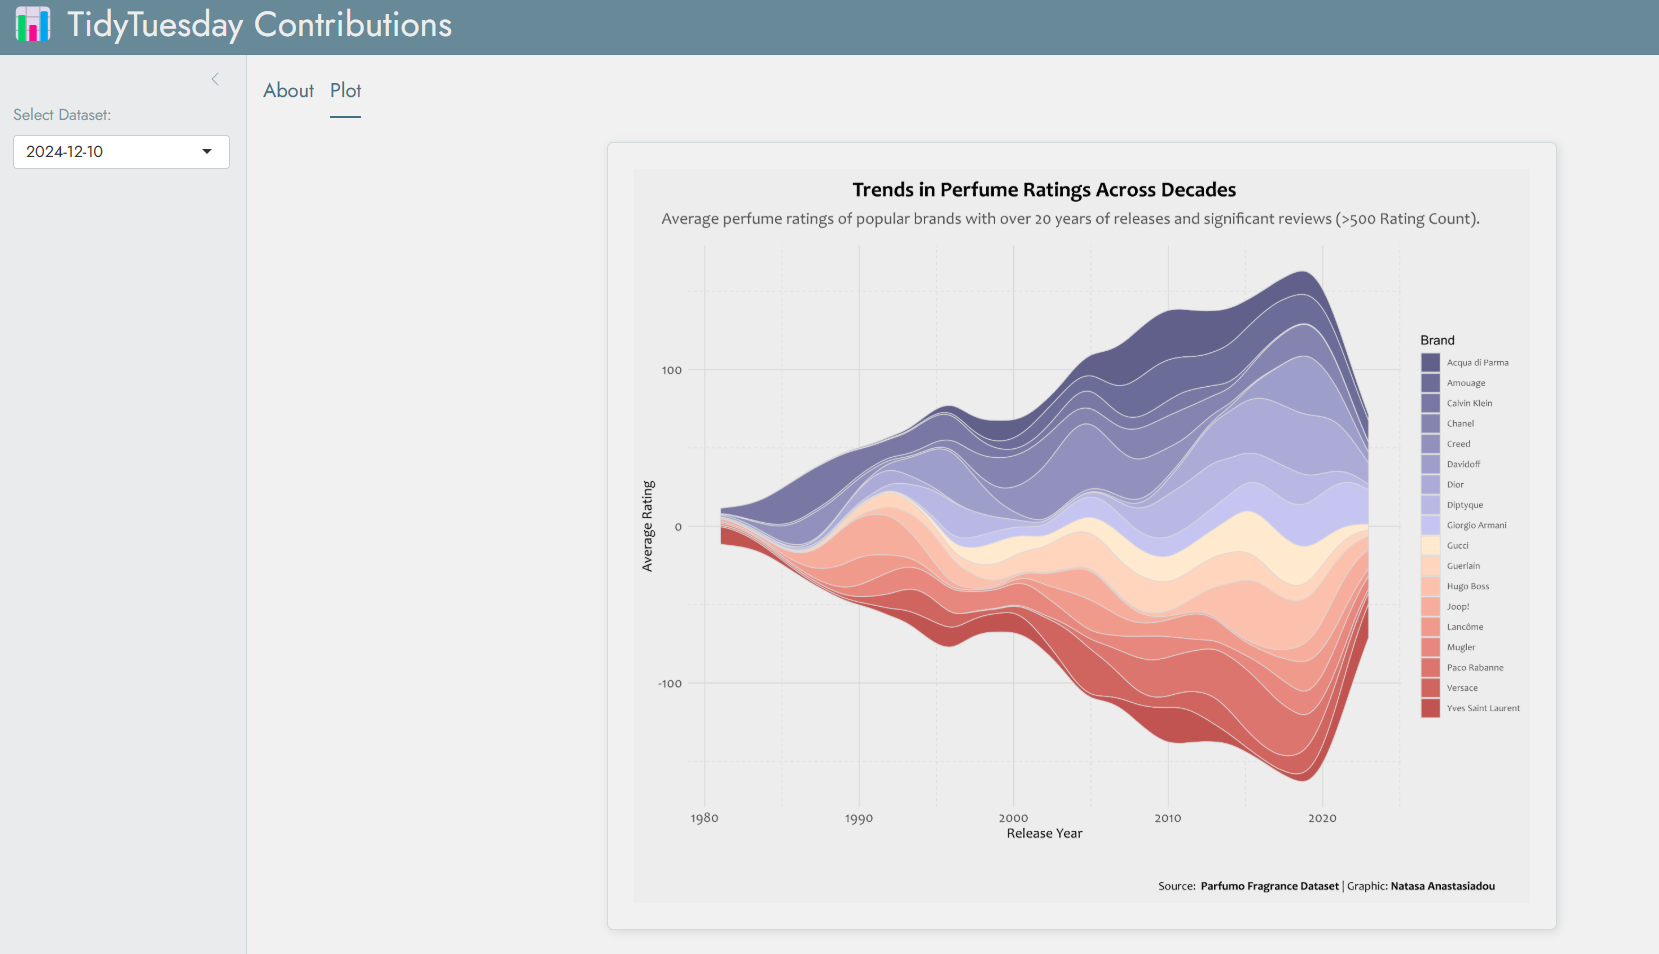
This Shiny app is an extension of my participation in the #TidyTuesday challenge.